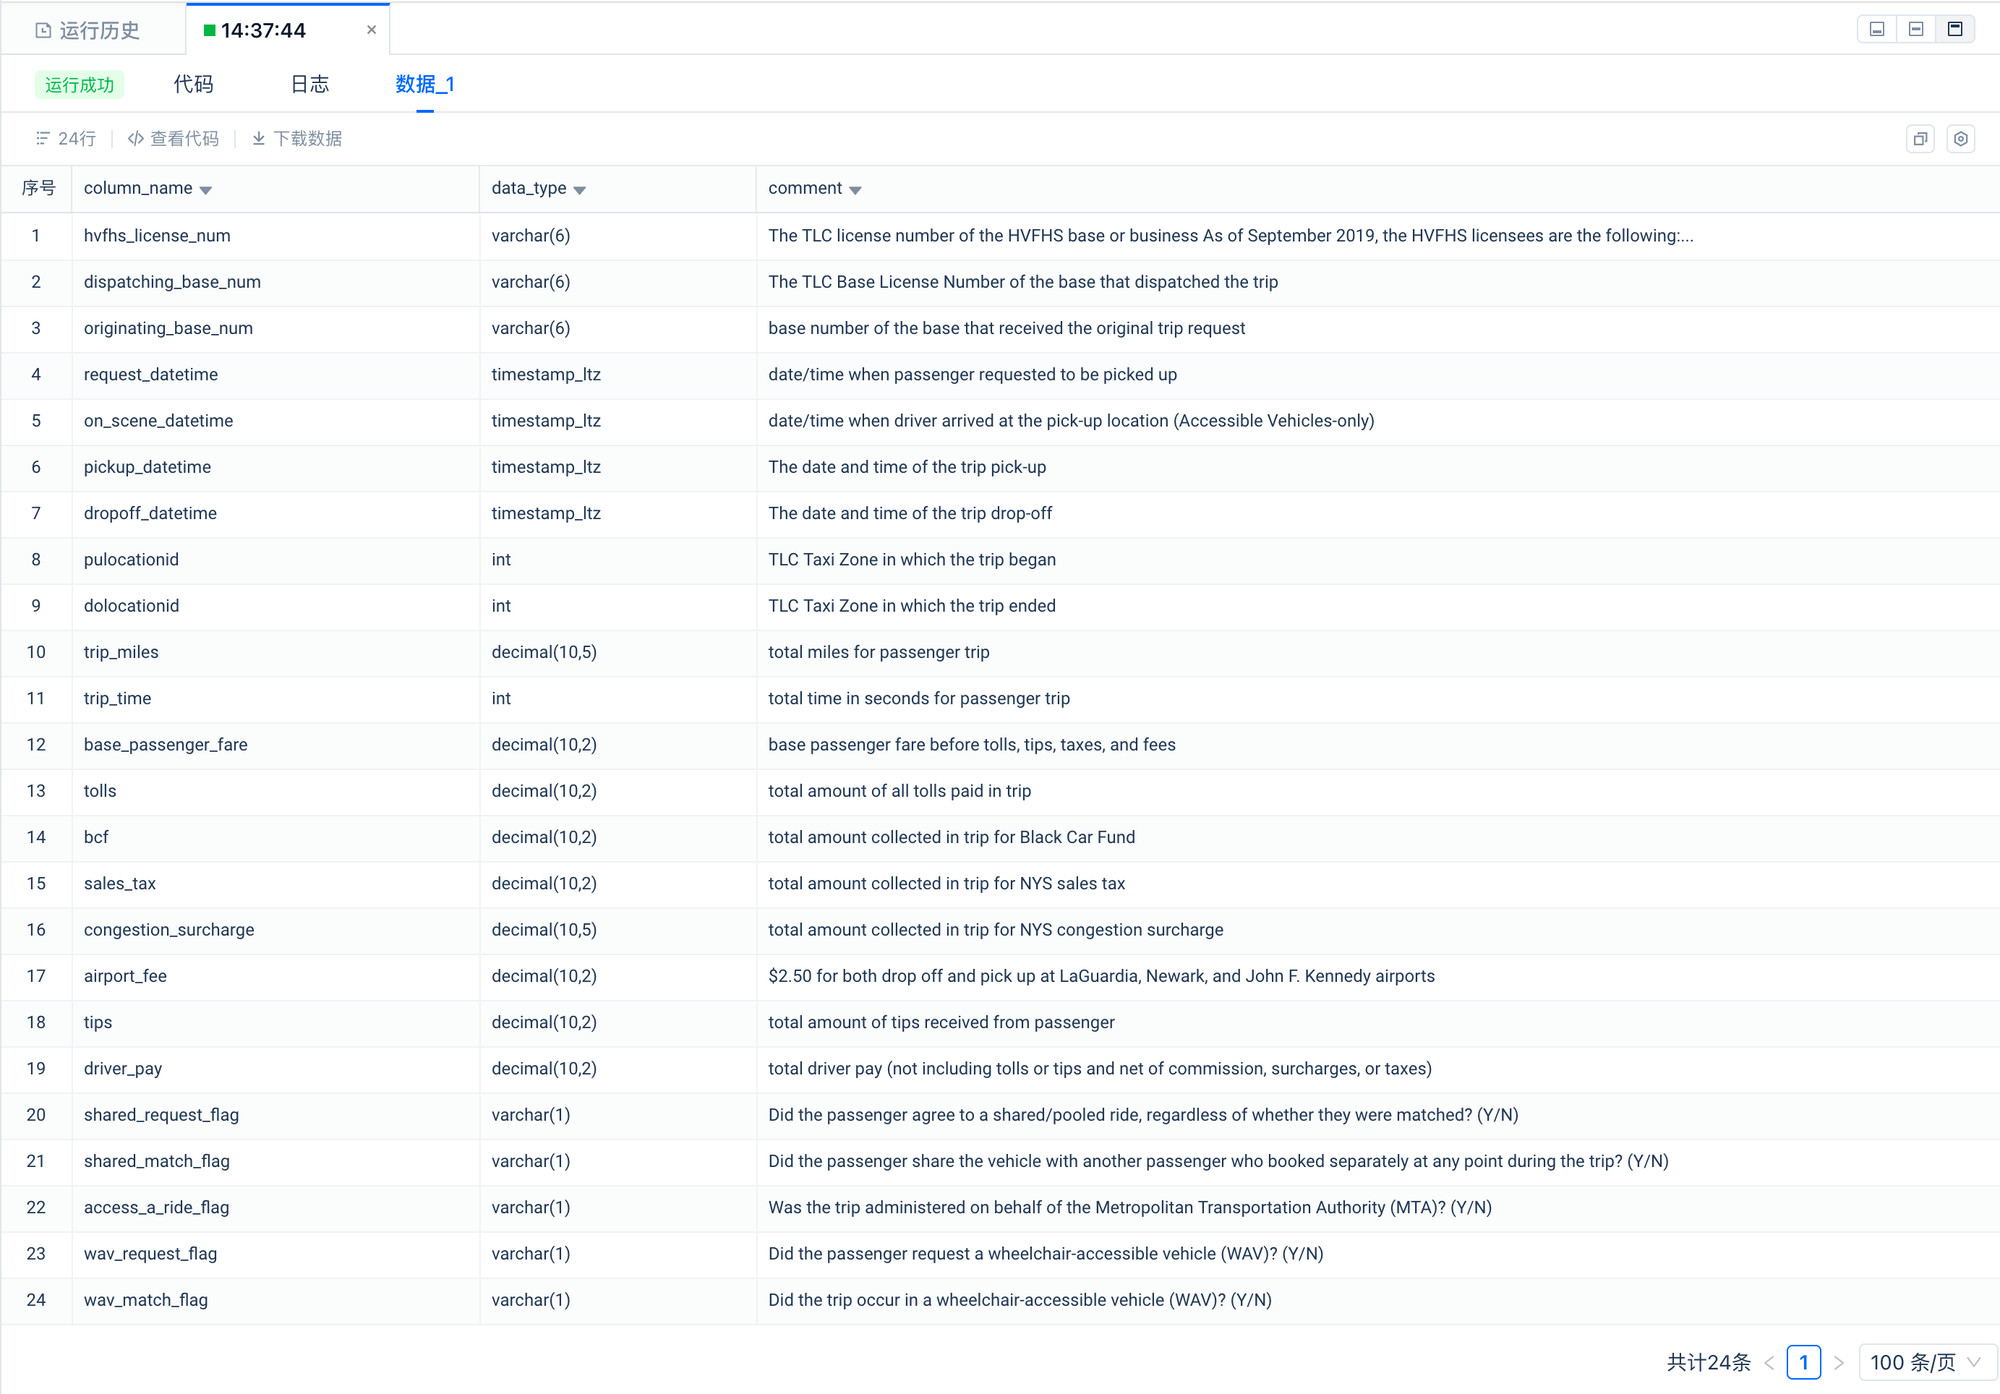
--Describes New York City For-Hire-Vehicle trips.
desc clickzetta_sample_data.nyc_taxi_tripdata.fhvhv_tripdata;
预览
2.2 预览数据明细
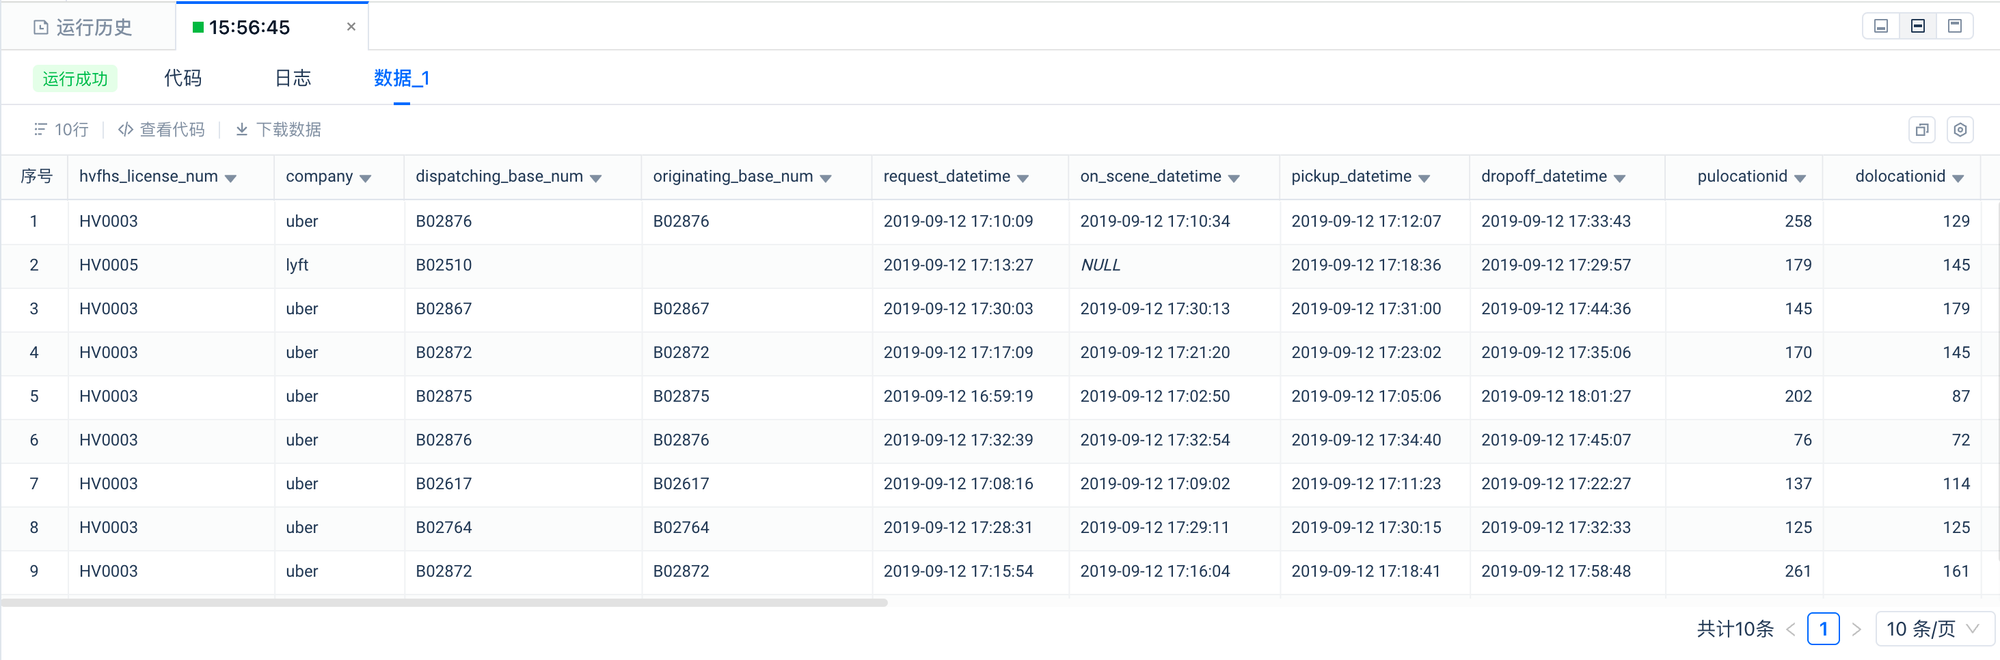
--Sample Of Trip Record Data
select * from clickzetta_sample_data.nyc_taxi_tripdata.fhvhv_tripdata limit 10;
预览
2.3 查看数据集的记录数
--1.49 billion rows
select count(*) from clickzetta_sample_data.nyc_taxi_tripdata.fhvhv_tripdata;
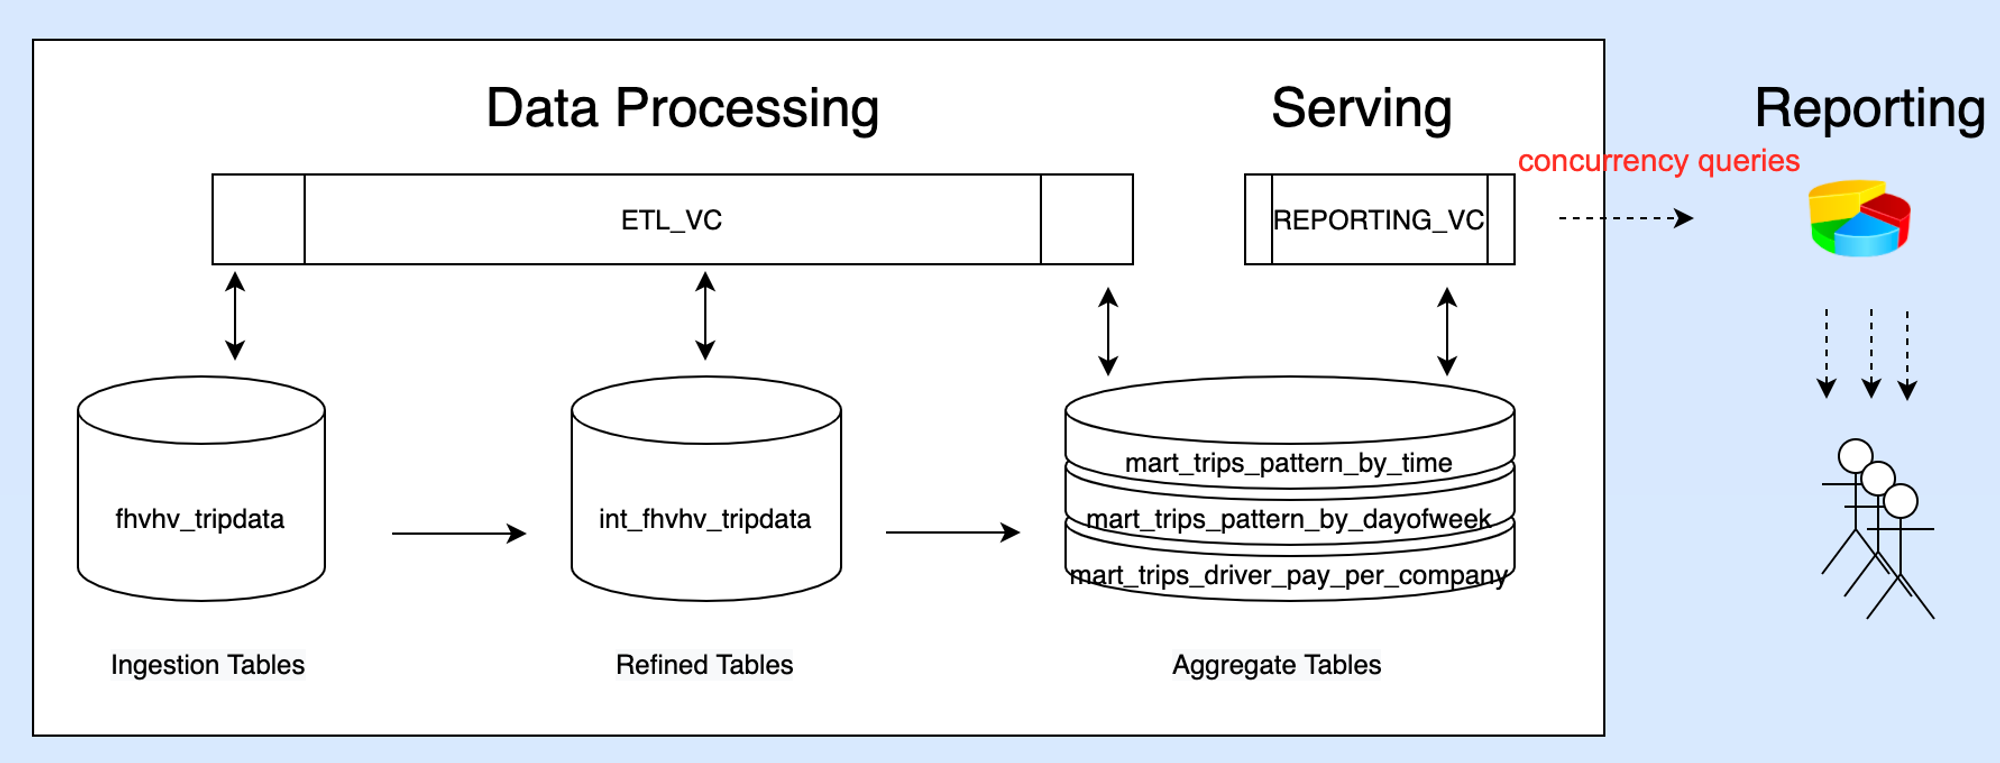
Step02 使用通用型集群清洗转换数据
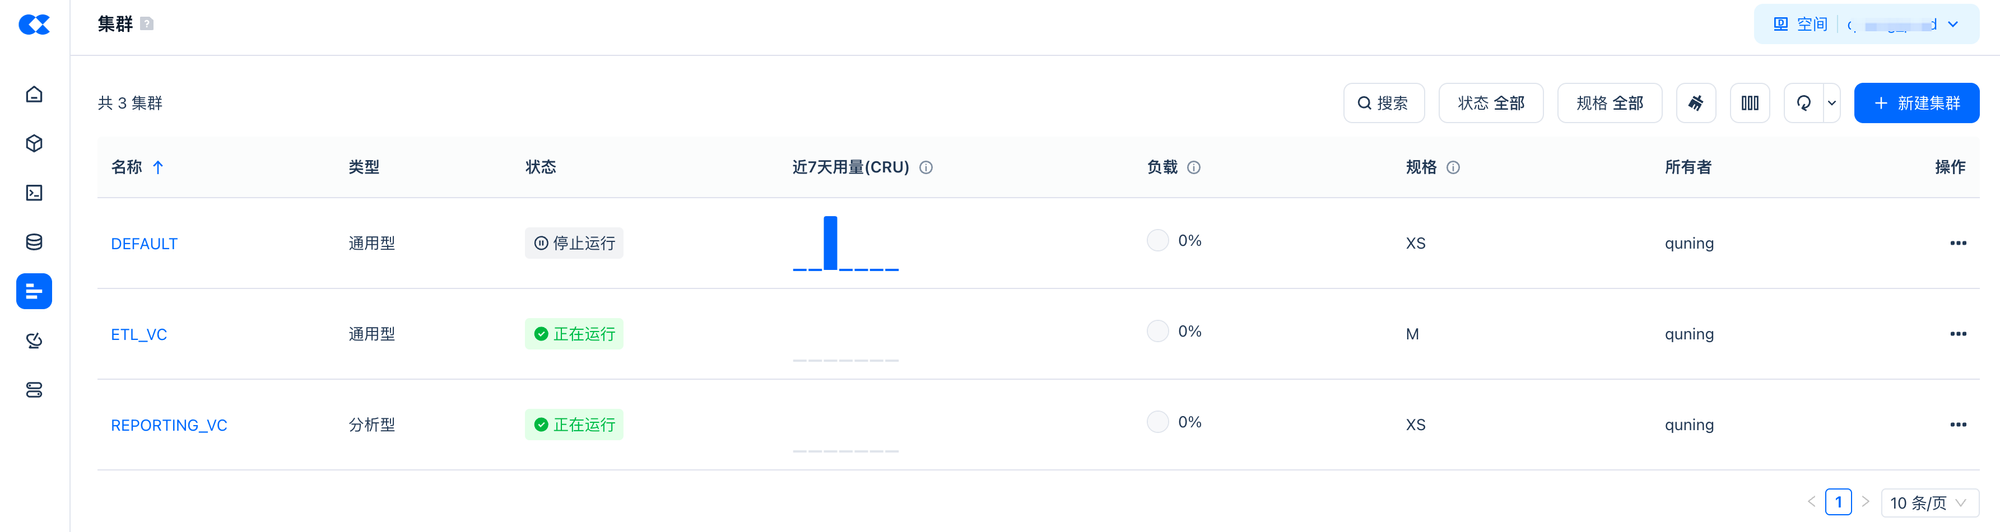
指定使用
ETL_VC
ETL_VC
进行数据加工,同时创建目标表所在的 Schema
--要和执行的SQL一起选中执行才会生效
use vcluster ETL_VC;
create schema tutorial;
use tutorial;
通过 CTAS 对原始数据集进行清洗转换并写入新表
--2.对原始数据集进行清洗转换
CREATE table tutorial.int_fhvhv_tripdata
as
SELECT
hvfhs_license_num,
CASE
WHEN hvfhs_license_num = 'HV0002' THEN 'juno'
WHEN hvfhs_license_num = 'HV0003' THEN 'uber'
WHEN hvfhs_license_num = 'HV0004' THEN 'via'
WHEN hvfhs_license_num = 'HV0005' THEN 'lyft'
ELSE null
END AS company,
ltrim(rtrim(upper(dispatching_base_num))) dispatching_base_num,
ltrim(rtrim(upper(originating_base_num))) originating_base_num,
request_datetime,
on_scene_datetime,
pickup_datetime,
dropoff_datetime,
PULocationID,
DOLocationID,
trip_miles,
trip_time,
base_passenger_fare,
tolls,
bcf,
sales_tax,
congestion_surcharge,
airport_fee,
tips,
driver_pay,
CASE
WHEN shared_request_flag = 'Y' THEN true
WHEN shared_request_flag IN ('N', ' ') THEN false
ELSE null
END AS shared_request_flag,
CASE
WHEN shared_match_flag = 'Y' THEN true
WHEN shared_match_flag IN ('N', ' ') THEN false
ELSE null
END AS shared_match_flag,
CASE
WHEN access_a_ride_flag = 'Y' THEN true
WHEN access_a_ride_flag IN ('N', ' ') THEN false
ELSE null
END AS access_a_ride_flag,
CASE
WHEN wav_request_flag = 'Y' THEN true
WHEN wav_request_flag IN ('N', ' ') THEN false
ELSE null
END AS wav_request_flag,
CASE
WHEN wav_match_flag = 'Y' THEN true
WHEN wav_match_flag IN ('N', ' ') THEN false
ELSE null
END AS wav_match_flag
FROM clickzetta_sample_data.nyc_taxi_tripdata.fhvhv_tripdata;
验证加工后的数据
SELECT * FROM tutorial.int_fhvhv_tripdata LIMIT 10;
预览
对清洗后的数据按照分析主题分别进行聚合计算,生成用于分析的数据表。
--Scenario 1: Analyze taxi trip patterns by time of day
CREATE table tutorial.mart_trips_pattern_by_time
AS
SELECT
EXTRACT(HOUR FROM pickup_datetime) AS hour,
COUNT(*) AS trip_count
FROM tutorial.int_fhvhv_tripdata
GROUP BY hour;
--Scenario 2: Analyze taxi trip patterns by day of the week
CREATE table tutorial.mart_trips_pattern_by_dayofweek
AS
SELECT
EXTRACT(DAY FROM pickup_datetime) AS day_of_week,
COUNT(*) AS trip_count
FROM tutorial.int_fhvhv_tripdata
GROUP BY day_of_week;
--Scenario 3: Analyze taxi trip patterns by pickup location
CREATE table tutorial.mart_trips_pattern_by_pickup_location
AS
SELECT
PULocationID,
COUNT(*) AS trip_count
FROM tutorial.int_fhvhv_tripdata
GROUP BY PULocationID;
--Scenario 4: Analyze taxi trip patterns by dropoff location
CREATE table tutorial.mart_trips_pattern_by_dropoff_location
AS
SELECT
DOLocationID,
COUNT(*) AS trip_count
FROM tutorial.int_fhvhv_tripdata
GROUP BY DOLocationID;
--Scenario 5:Trips per day
CREATE table tutorial.mart_trips_per_day
AS
SELECT
pickup_datetime::date AS date,
sum(trip_miles) AS trip_miles
FROM tutorial.int_fhvhv_tripdata
GROUP BY date;
--Scenario 6:Total driver pay per company
CREATE table tutorial.mart_trips_driver_pay_per_company
AS
SELECT
CONCAT(YEAR(pickup_datetime), '-', MONTH(pickup_datetime)) AS year_month,
company,
sum(driver_pay) AS driver_pay
FROM tutorial.int_fhvhv_tripdata
GROUP BY year_month,company;
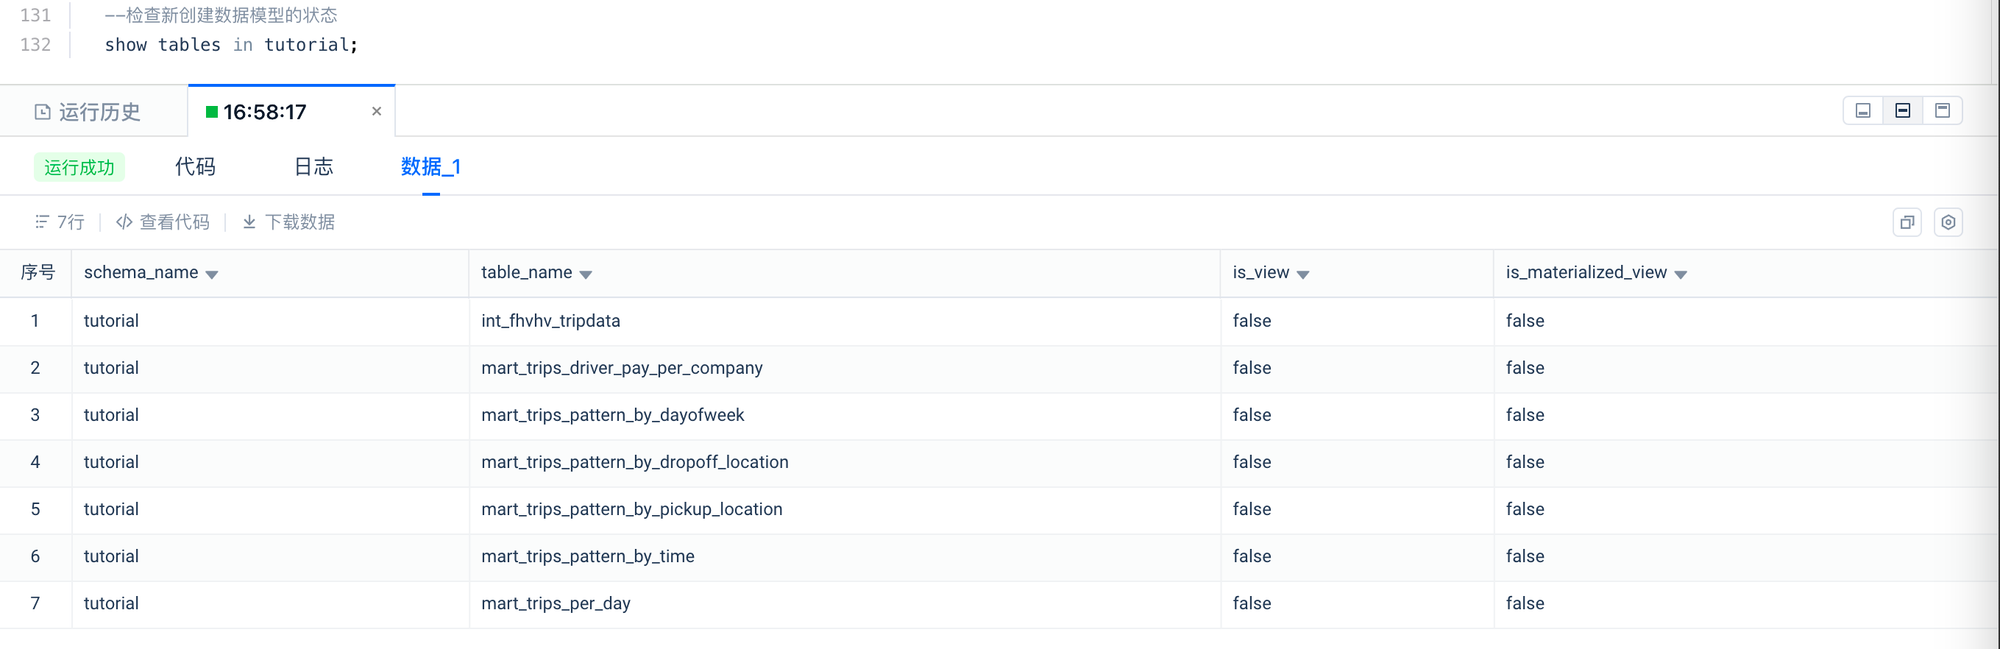
检查数据对象是否创建成功。
--检查新创建数据模型的状态
show tables in tutorial;
预览
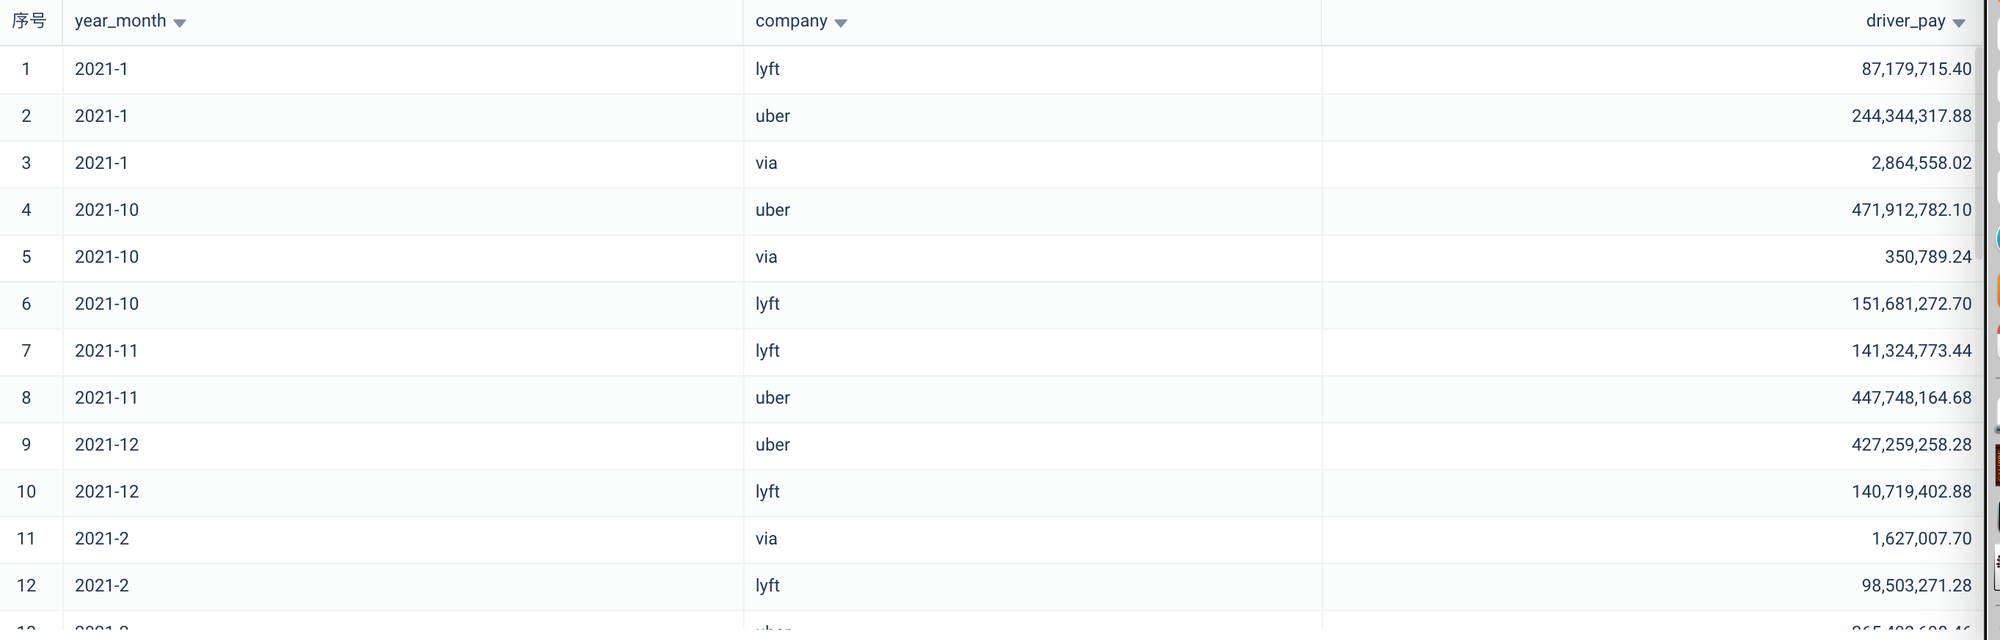
--检查新创建数据模型的数据
SELECT * FROM tutorial.mart_trips_driver_pay_per_company
WHERE substr(year_month,0,4)='2021'
ORDER BY year_month ASC;
预览
Step03 使用分析型集群单并发查询
切换当前 Session 使用的虚拟集群为 REPORTING_VC。
-- 1.使用分析型VC进行加速查询分析,要和执行的SQL一起选中执行才会生效
USE VCLUSTER REPORTING_VC;
--设置查询作业标签,以便检索过滤,要和执行的SQL一起选中执行才会生效
SET QUERY_TAG = 'Tutorial02';
串行执行 6 个业务分析查询。
--Scenario 1: Analyze taxi trip patterns by time of day
SELECT * FROM tutorial.mart_trips_pattern_by_time
ORDER BY HOUR ASC;
--Scenario 2: Analyze taxi trip patterns by day of the week
SELECT * FROM tutorial.mart_trips_pattern_by_dayofweek
ORDER BY day_of_week ASC;
--Scenario 3: Analyze taxi trip patterns by pickup location
SELECT * FROM tutorial.mart_trips_pattern_by_pickup_location
ORDER BY trip_count DESC
LIMIT 10;
--Scenario 4: Analyze taxi trip patterns by dropoff location
SELECT * FROM tutorial.mart_trips_pattern_by_dropoff_location
ORDER BY trip_count DESC
LIMIT 10;
--Scenario 5:Trips per day
SELECT * FROM tutorial.mart_trips_per_day
WHERE CONCAT(YEAR(date) , MONTH(date)) = '202110'
ORDER BY date;
--Scenario 6:Total driver pay per company
SELECT * FROM tutorial.mart_trips_driver_pay_per_company
WHERE substr(year_month,0,4)='2021'
ORDER BY year_month ASC;
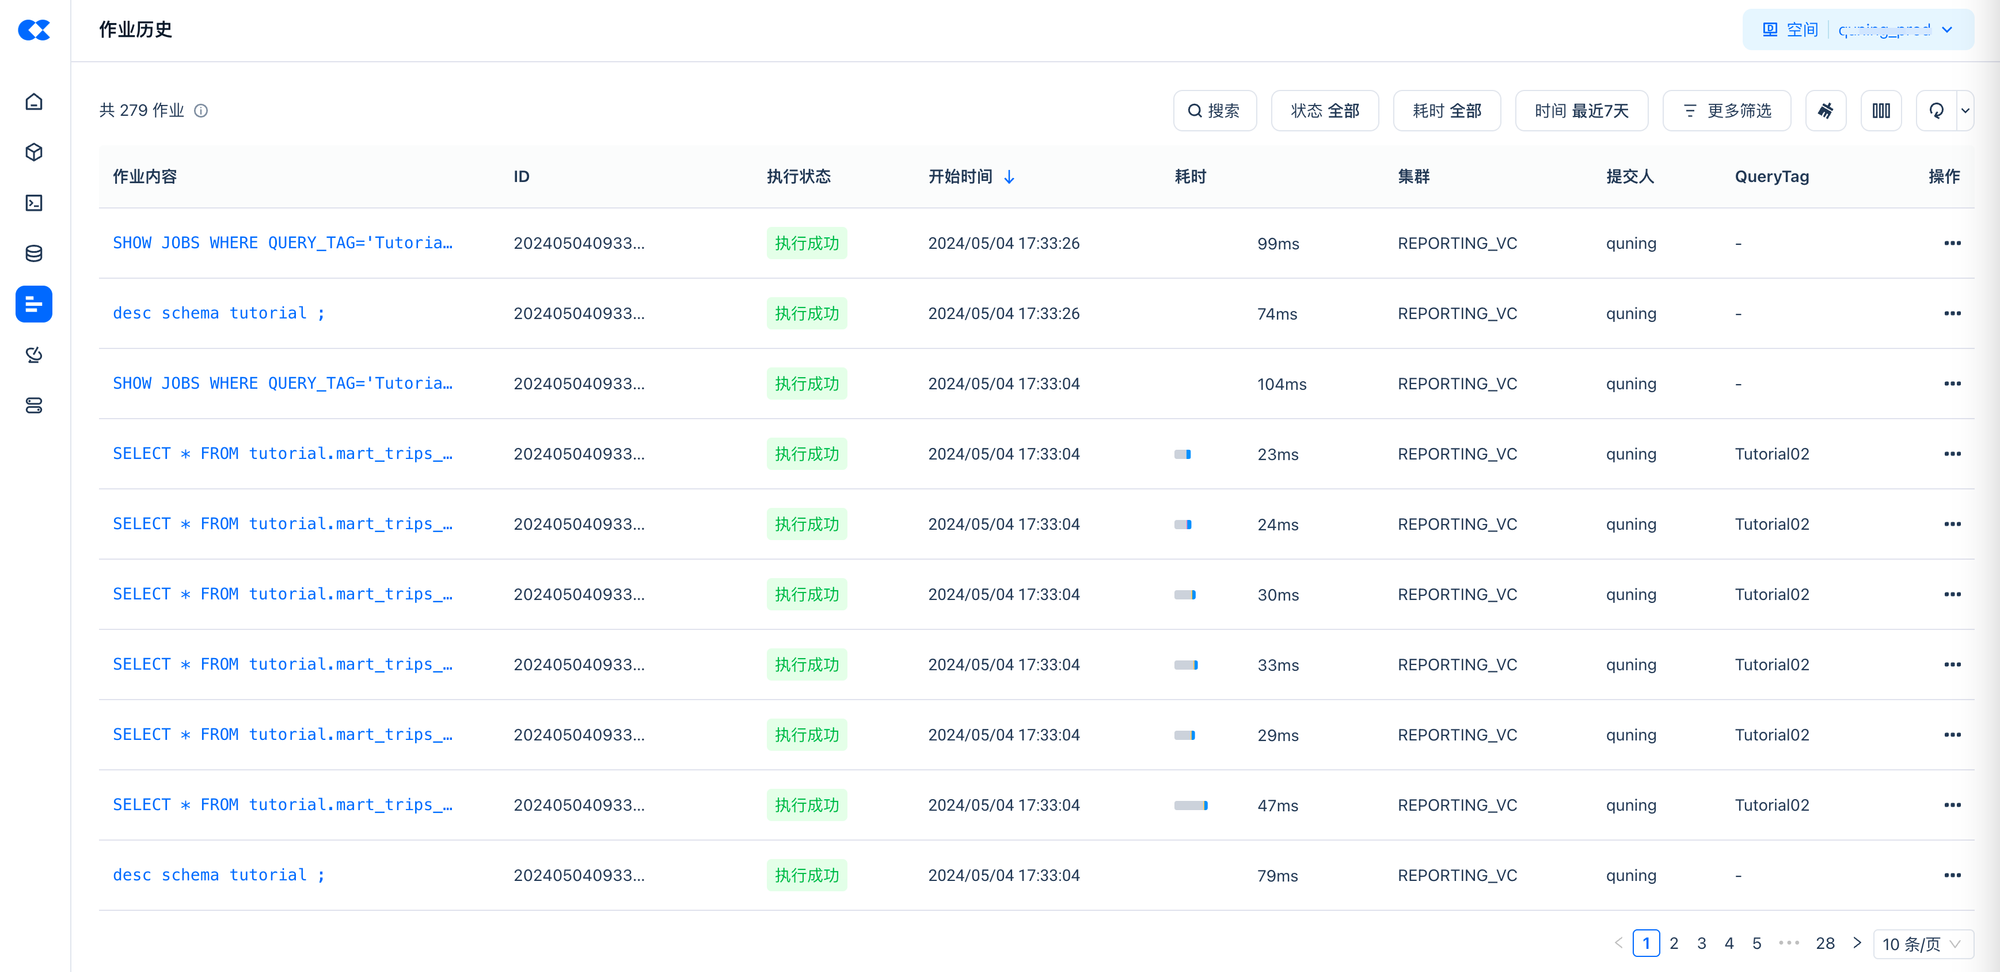
观察查询的 Latency 结果。
--清除QUERY_TAG
SET QUERY_TAG = '';
--查看运行的作业执行结果
SHOW JOBS WHERE QUERY_TAG='Tutorial02' LIMIT 10;
#
from clickzetta import connect
import random
import time
import concurrent.futures
import threading
from queue import Queue
from datetime import datetime
建立连接:
conn = connect(
username='xxx', # 替换为当前登录用户名
password='xxx', # 替换登录密码
service='region_id.api.clickzetta.com',
instance='xxx', # 替换当前服务实例名称。可查看浏览器域名地址,格式为:<instance-name>.<Region_ID>.app.clickzetta.com。例如: 19d58db8.cn-shanghai-alicloud.app.clickzetta.com中,19d58db8代表服务实例名称。
workspace='xxx', # 替换工作空间名称
schema='tutorial',
vcluster='reporting_vc'
)
queries = [
"""
SELECT * FROM tutorial.mart_trips_pattern_by_time ORDER BY HOUR ASC;
""",
"""
SELECT * FROM tutorial.mart_trips_pattern_by_dayofweek ORDER BY day_of_week ASC;
""",
"""
SELECT * FROM tutorial.mart_trips_pattern_by_pickup_location ORDER BY trip_count DESC LIMIT 10;
""",
"""
SELECT * FROM tutorial.mart_trips_pattern_by_dropoff_location ORDER BY trip_count DESC LIMIT 10;
""",
"""
SELECT * FROM tutorial.mart_trips_per_day WHERE CONCAT(YEAR(date) , MONTH(date)) = '202110' ORDER BY date;
""",
"""
SELECT * FROM tutorial.mart_trips_driver_pay_per_company WHERE substr(year_month,0,4)='2021' ORDER BY year_month ASC;
"""
]
def query_task(barrier, query_queue, all_latencies):
while True:
# 等待所有线程准备好
barrier.wait()
# 提交查询任务
query = query_queue.get()
if query is None:
break
latency = submit_query_and_measure_latency(query)
all_latencies.append(latency)
query_queue.task_done()
查看计算集群的弹性并发配置动态变化:
def check_cluster_concurrency_scaling():
cursor = conn.cursor()
# 执行 SQL 查询
cursor.execute('desc vcluster reporting_vc;')
# 获取查询结果
results = cursor.fetchall()
for row in results:
if row[0] == 'current_replicas':
print(row)
主函数:
if __name__ == "__main__":
num_concurrent_list = [4, 8, 12, 16] # 不同并发量
rounds = 30
for num_threads in num_concurrent_list:
print(f"---Running with {num_threads} concurrent queries:---")
# 用于存储所有线程的结果的共享列表
all_latencies = []
# 创建查询队列
query_queue = Queue()
# 将查询任务放入队列
for _ in range(num_threads):
for _ in range(rounds):
query = random.choice(queries)
query_queue.put(query)
# 创建 Barrier,等待所有线程同时准备好
barrier = threading.Barrier(num_threads)
# 创建并启动线程
threads = []
results = []
start_times = []
for _ in range(num_threads):
thread = threading.Thread(target=query_task, args=(barrier, query_queue, all_latencies))
thread.start()
threads.append(thread)
# 等待所有查询任务完成
query_queue.join()
# 停止线程
for _ in range(num_threads):
query_queue.put(None)
for thread in threads:
thread.join()
# 计算指标
all_latencies.sort()
avg_latency = sum(all_latencies) / len(all_latencies)
p95_index = int(len(all_latencies) * 0.95)
p95_latency = all_latencies[p95_index]
p99_index = int(len(all_latencies) * 0.99)
p99_latency = all_latencies[p99_index]
qps = len(all_latencies) / sum(all_latencies)
# 打印结果
print("Totoal Queries:", len(all_latencies))
print("Average Latency:", avg_latency)
print("P95 Latency:", p95_latency)
print("P99 Latency:", p99_latency)
print("Queries per Second (QPS):", qps)
check_cluster_concurrency_scaling()
当设置 reporting_vc 的单 Replica 最大并发数为 4 时,打印结果示例如下:
--Running with 4 concurrent queries:--- Total Queries: 120 Average Latency: 0.2201933761437734 P95 Latency: 0.43064022064208984 P99 Latency: 0.683488130569458 Queries per Second (QPS): 4.5414626793635176 ('current_replicas', '1') ---Running with 8 concurrent queries:--- Total Queries: 240 Average Latency: 0.20615292688210804 P95 Latency: 0.2397170066833496 P99 Latency: 0.4295358657836914 Queries per Second (QPS): 4.850767898977571 ('current_replicas', '2') ---Running with 12 concurrent queries:--- Total Queries: 360 Average Latency: 0.2232776681582133 P95 Latency: 0.27333879470825195 P99 Latency: 0.46774768829345703 Queries per Second (QPS): 4.478728250115035 ('current_replicas', '3') ---Running with 16 concurrent queries:--- Total Queries: 480 Average Latency: 0.23430742422739664 P95 Latency: 0.25676393508911133 P99 Latency: 0.4392051696777344 Queries per Second (QPS): 4.267897200856488 ('current_replicas', '4')